FEATURED REPORTS
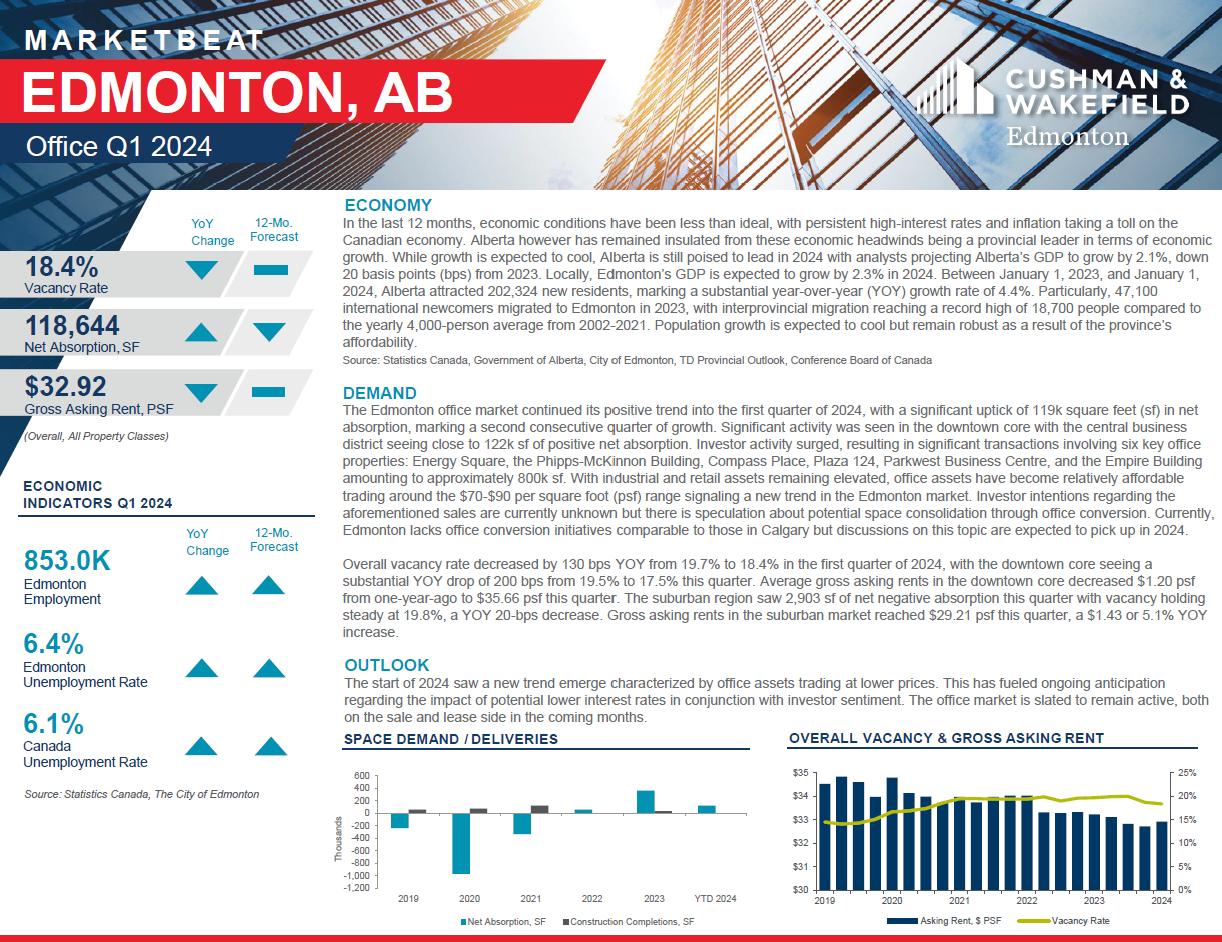
Q1. 2024 Office
Posted: May 2024
Office vacancy was 18.4% in Q1 2024, with the Edmonton office market seeing 118,644 sf in net absorption.
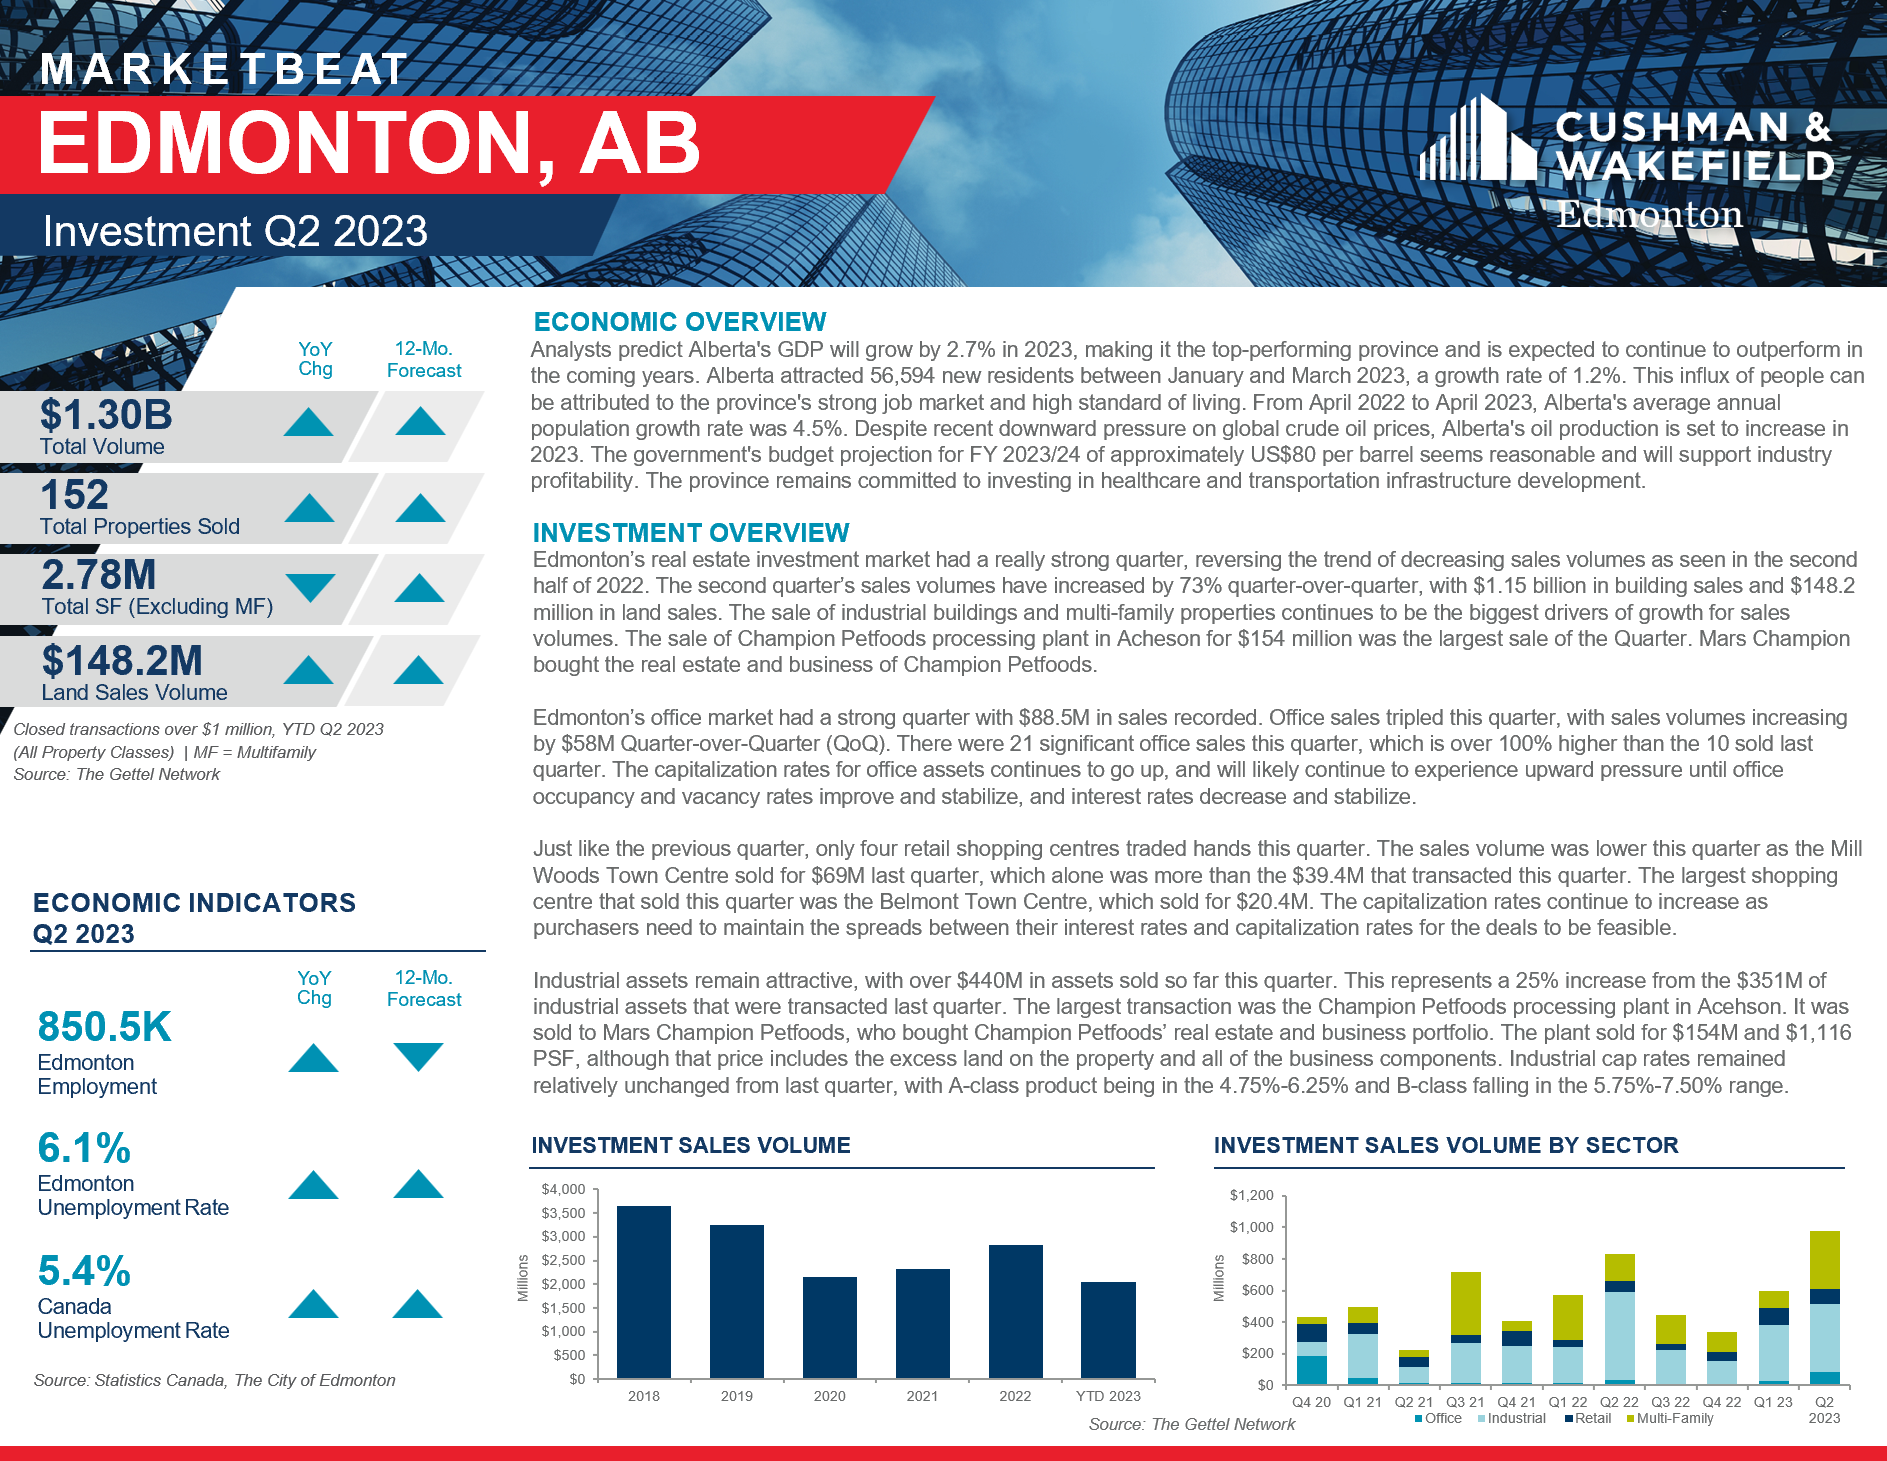
Q1. 2024 Investment
Posted: May 2024
Total sales volume for all asset classes in Q1 2024 totaled $934.2 million, a significant uptick reflecting a considerable 24% year-over-year increase.
H2. 2023 Multifamily
Posted: February 2024
74 total multifamily properties transacted in H2 2023, amounting to a total sales volume of $619.6M.
Q4. 2023 Investment
Posted: February 2024
Edmonton’s investment market experienced a remarkable surge of activity in Q4 2023, seeing a total sales volume of $838.3M.
q4. 2023 Office
Posted: February 2024
Overall vacancy rate decreased 130 bps to 18.7% in Q4 2023, with the Edmonton office market seeing 396,255 SF of positive net absorption.
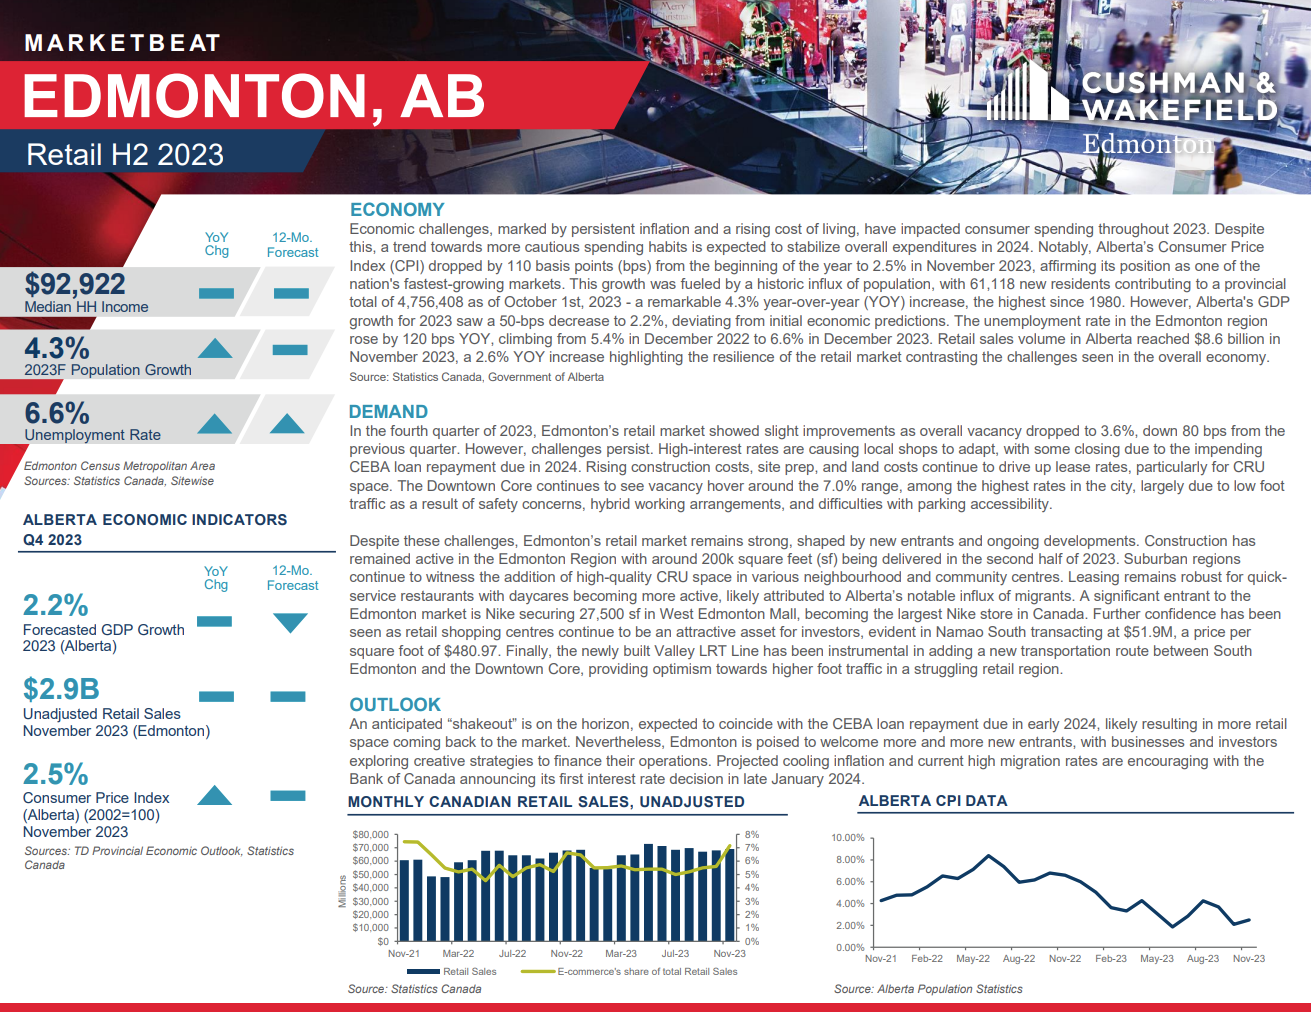
h2. 2023 Retail
Posted: February 2024
Edmonton’s retail market showed slight improvements as overall vacancy dropped 3.6%, down 80 basis points from the previous quarter.
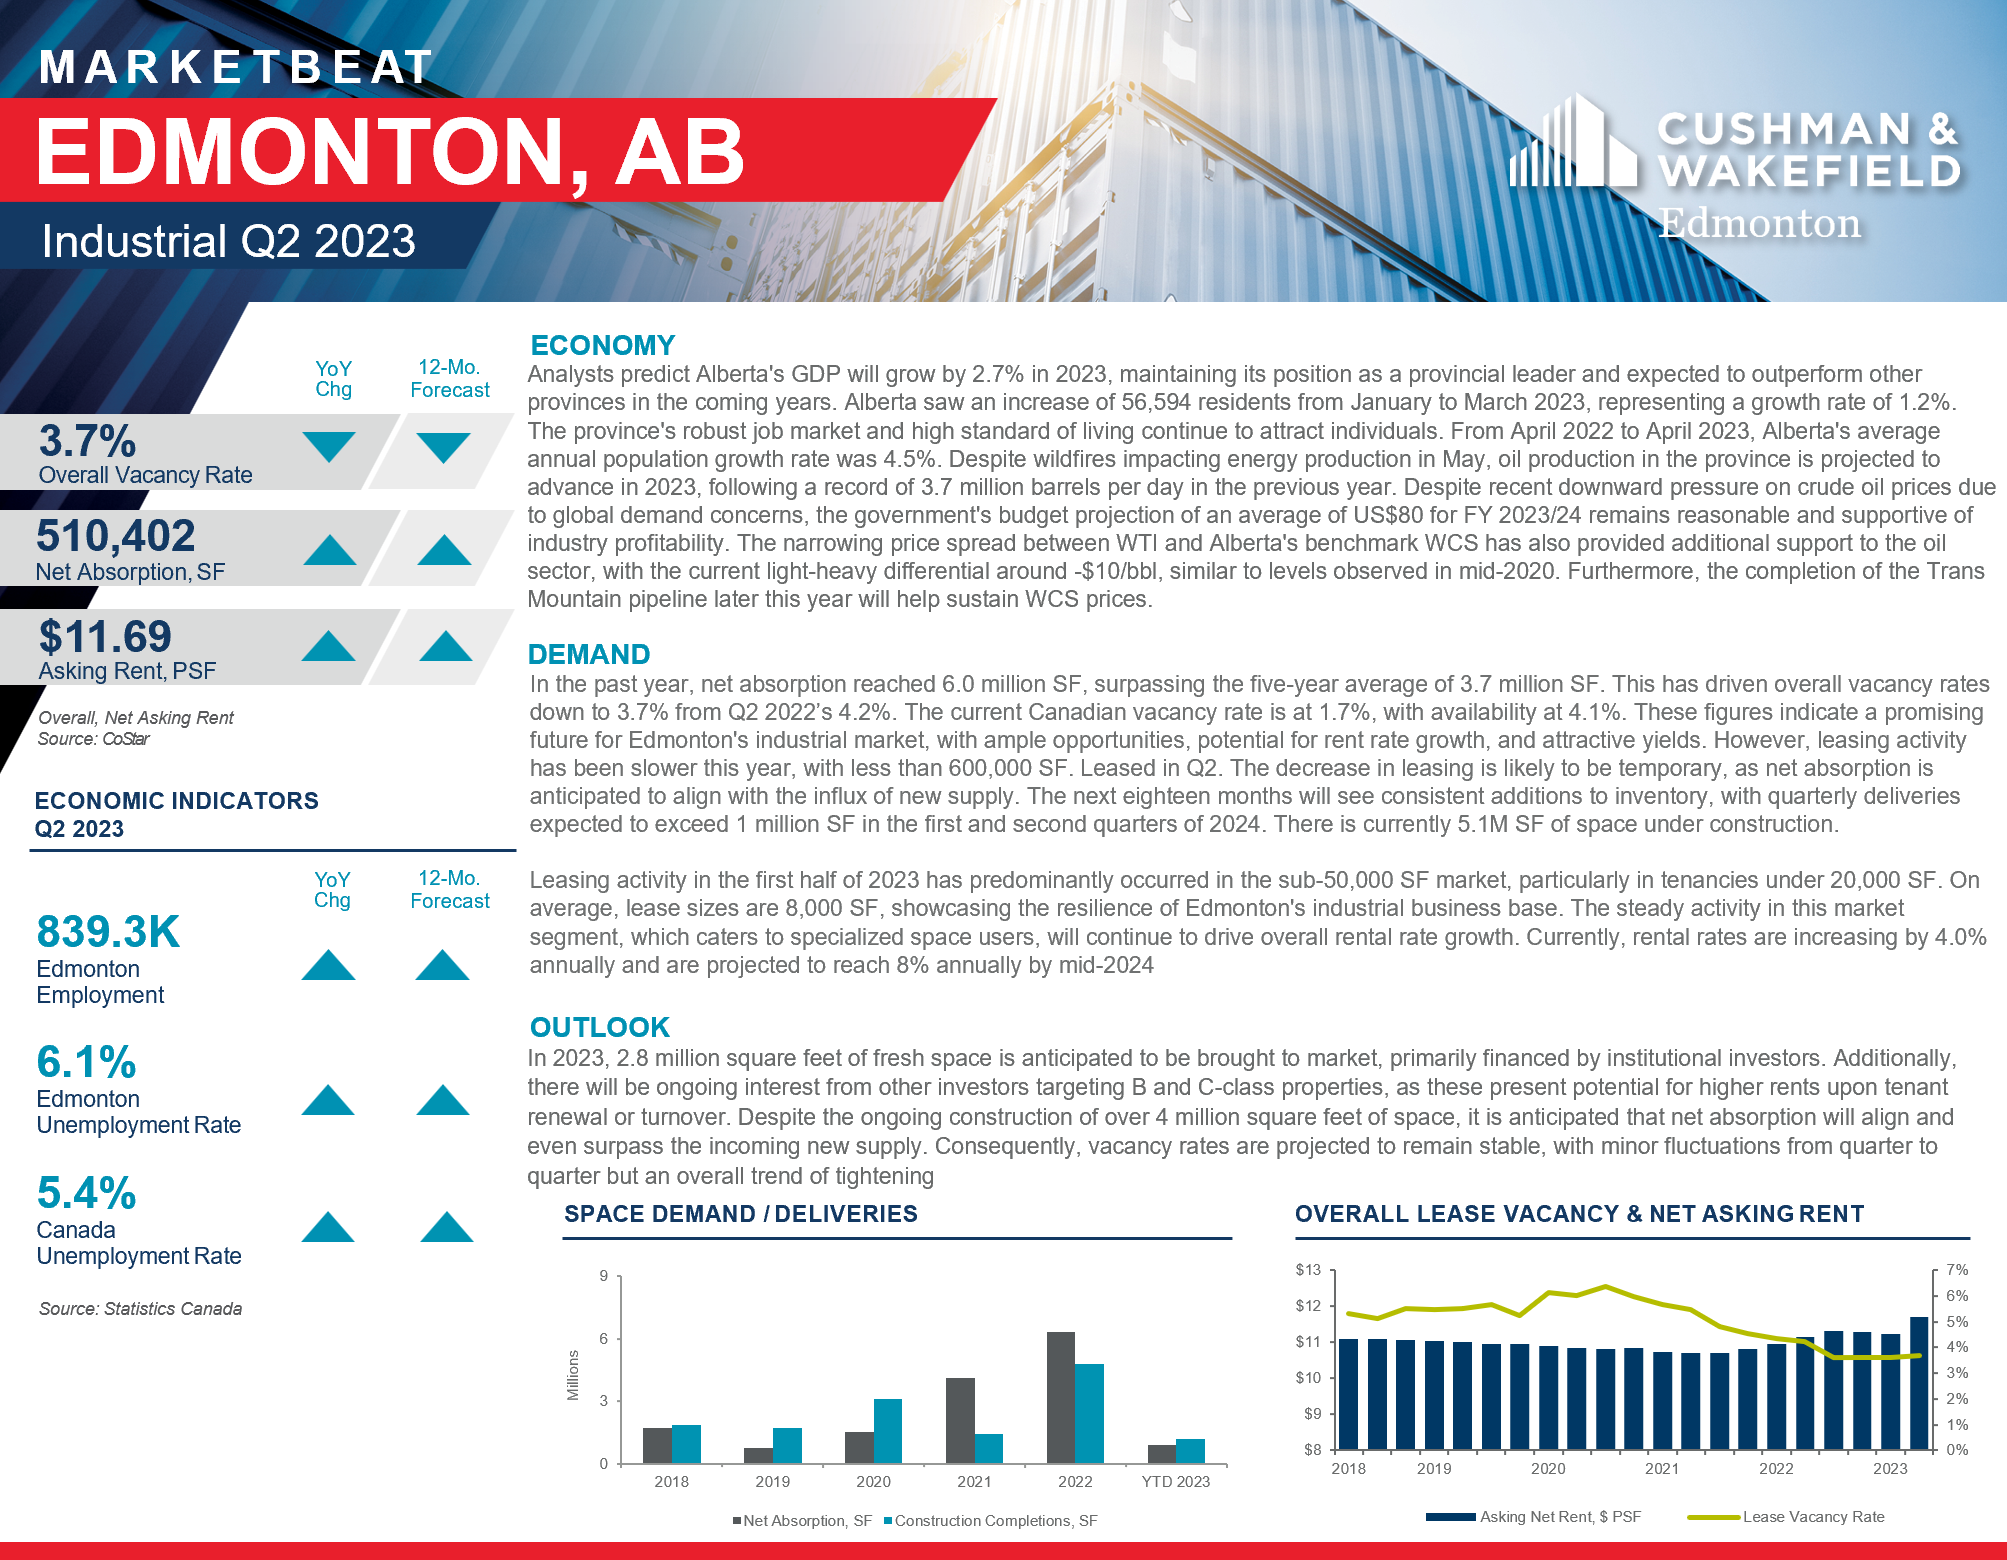
q3. 2023 industrial
Posted: November 2023
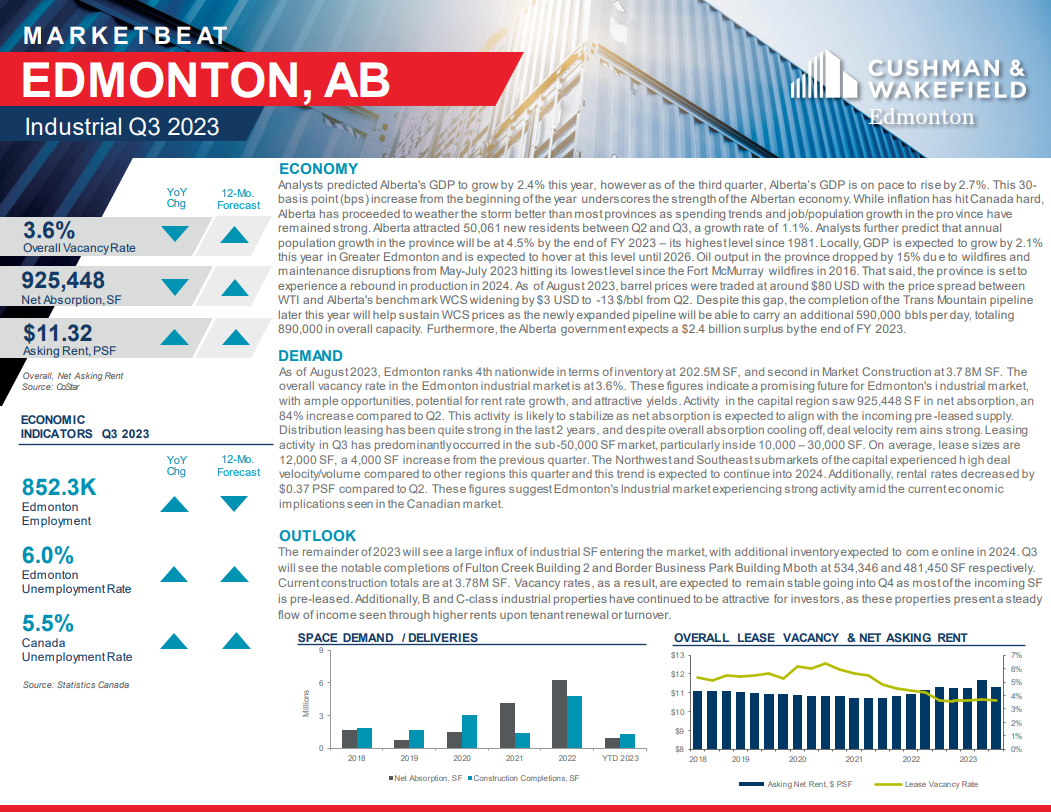
As of August 2023, Edmonton ranks 4th nationwide in inventory at 202.5M SF and second in Market Construction at 3.78M SF. Leasing activity saw over 925,000 SF in net absorption, an 84% increase compared to Q2, predominately driven by activity inside the 10,000 – 30,000 SF tenancies.
q3. 2023 office
Posted: November 2023
The Edmonton office market saw a flurry of newly signed deals and non-renewals in this quarter. However, leasing activity remained steady largely due to vacancy outpacing demand for office space. The city-wide vacancy rate as a result has remained stable at 20.0%.
Q3. 2023 INVestment
Posted: November 2023
Third-quarter sales volume totaled $790M, leading investment activity to be up $269.3M compared to this time last year. The sale of multi-family properties, industrial buildings, and land sales continue to be the largest growth drivers for sales volume, seeing 4 investment properties sell for over $50M.
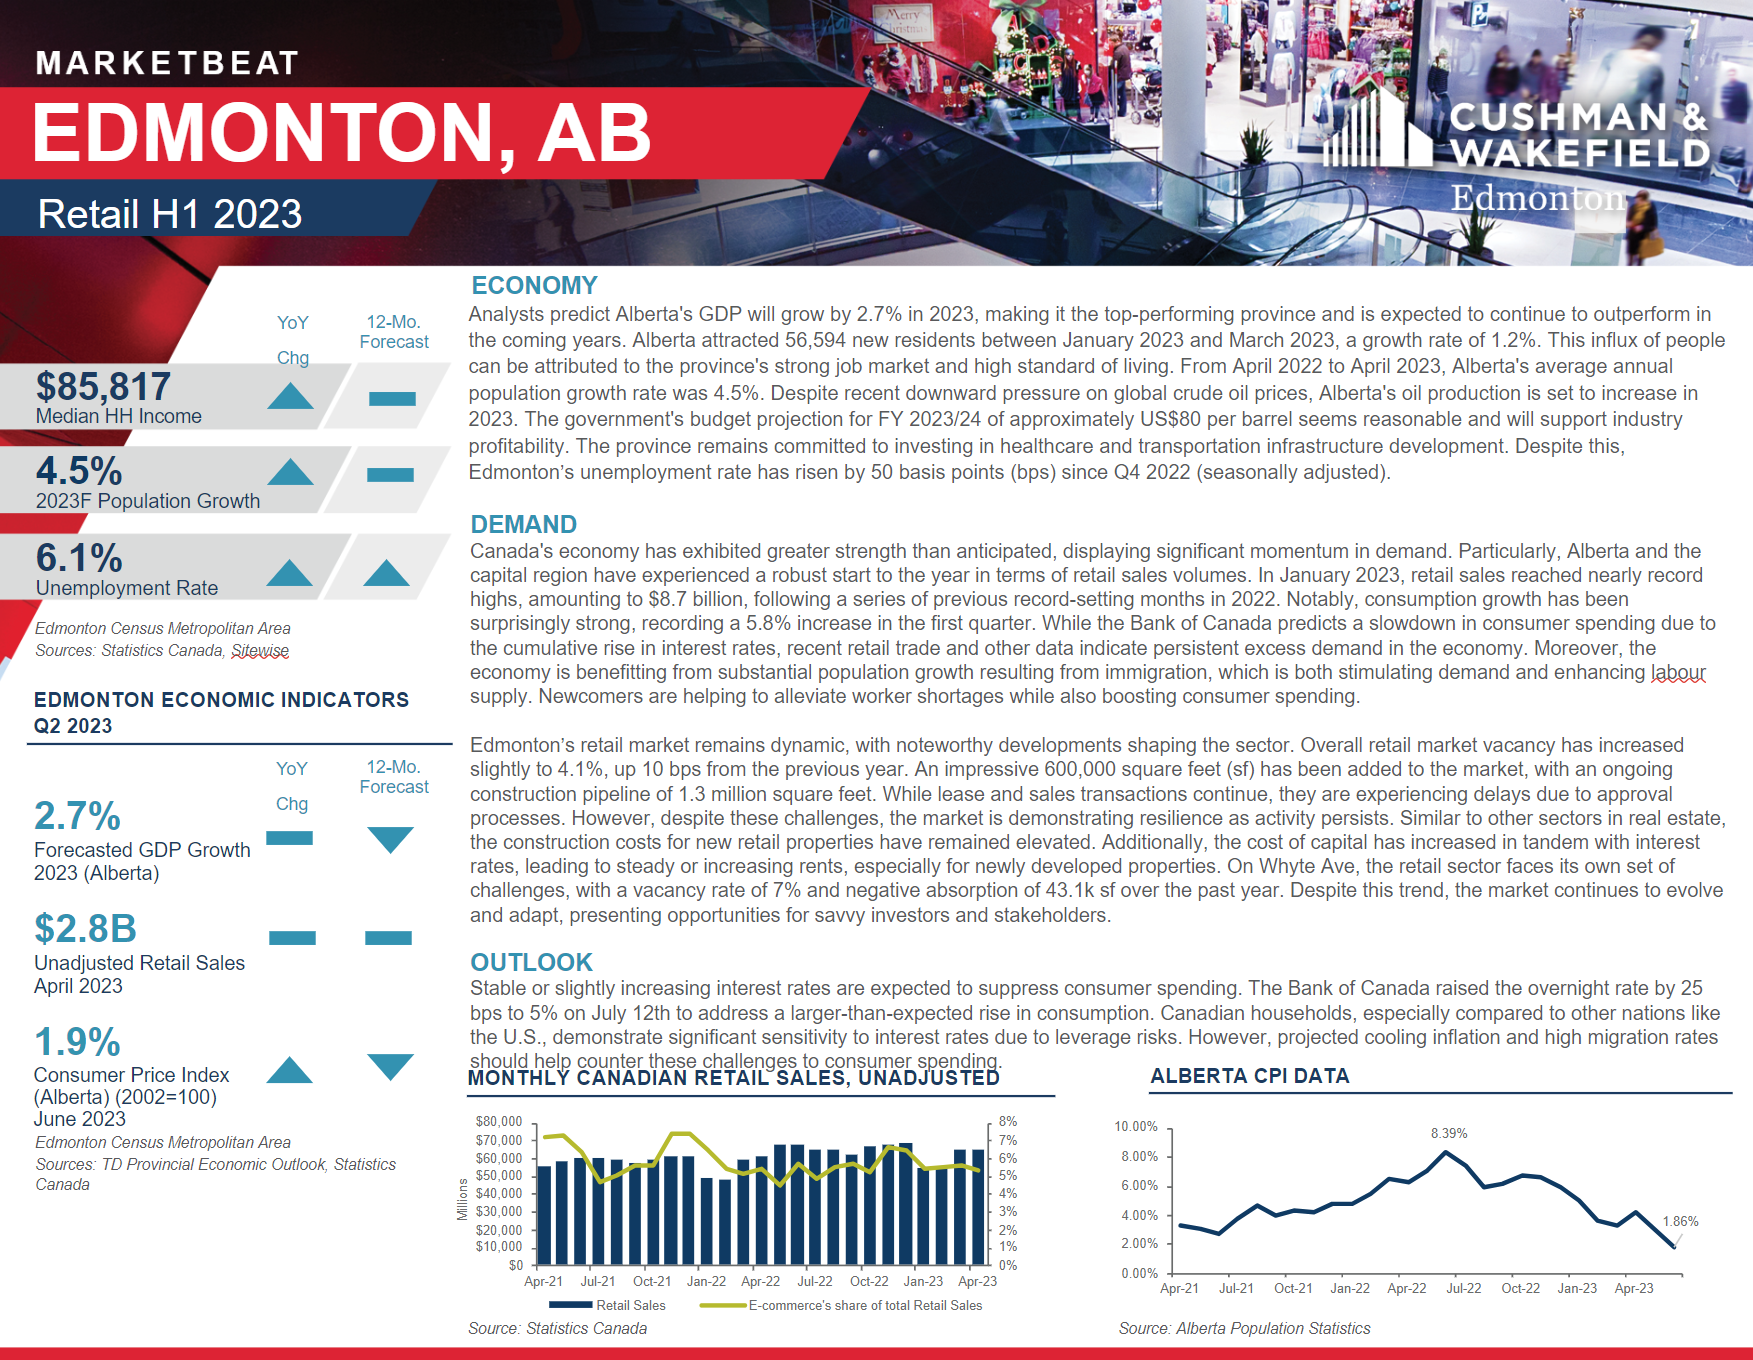
Edmonton retail report 2023
Posted: July 2023
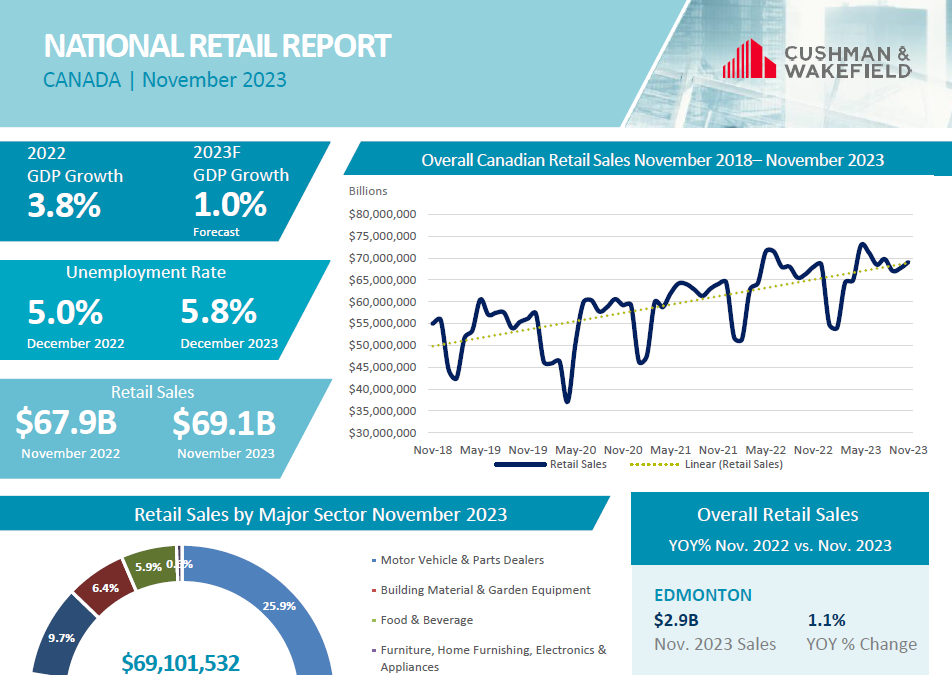
Strong retail sales momentum in Alberta continues. January 2023 saw record-high sales at $8.7B.
h1. 2023 multi-family
Posted: July 2023
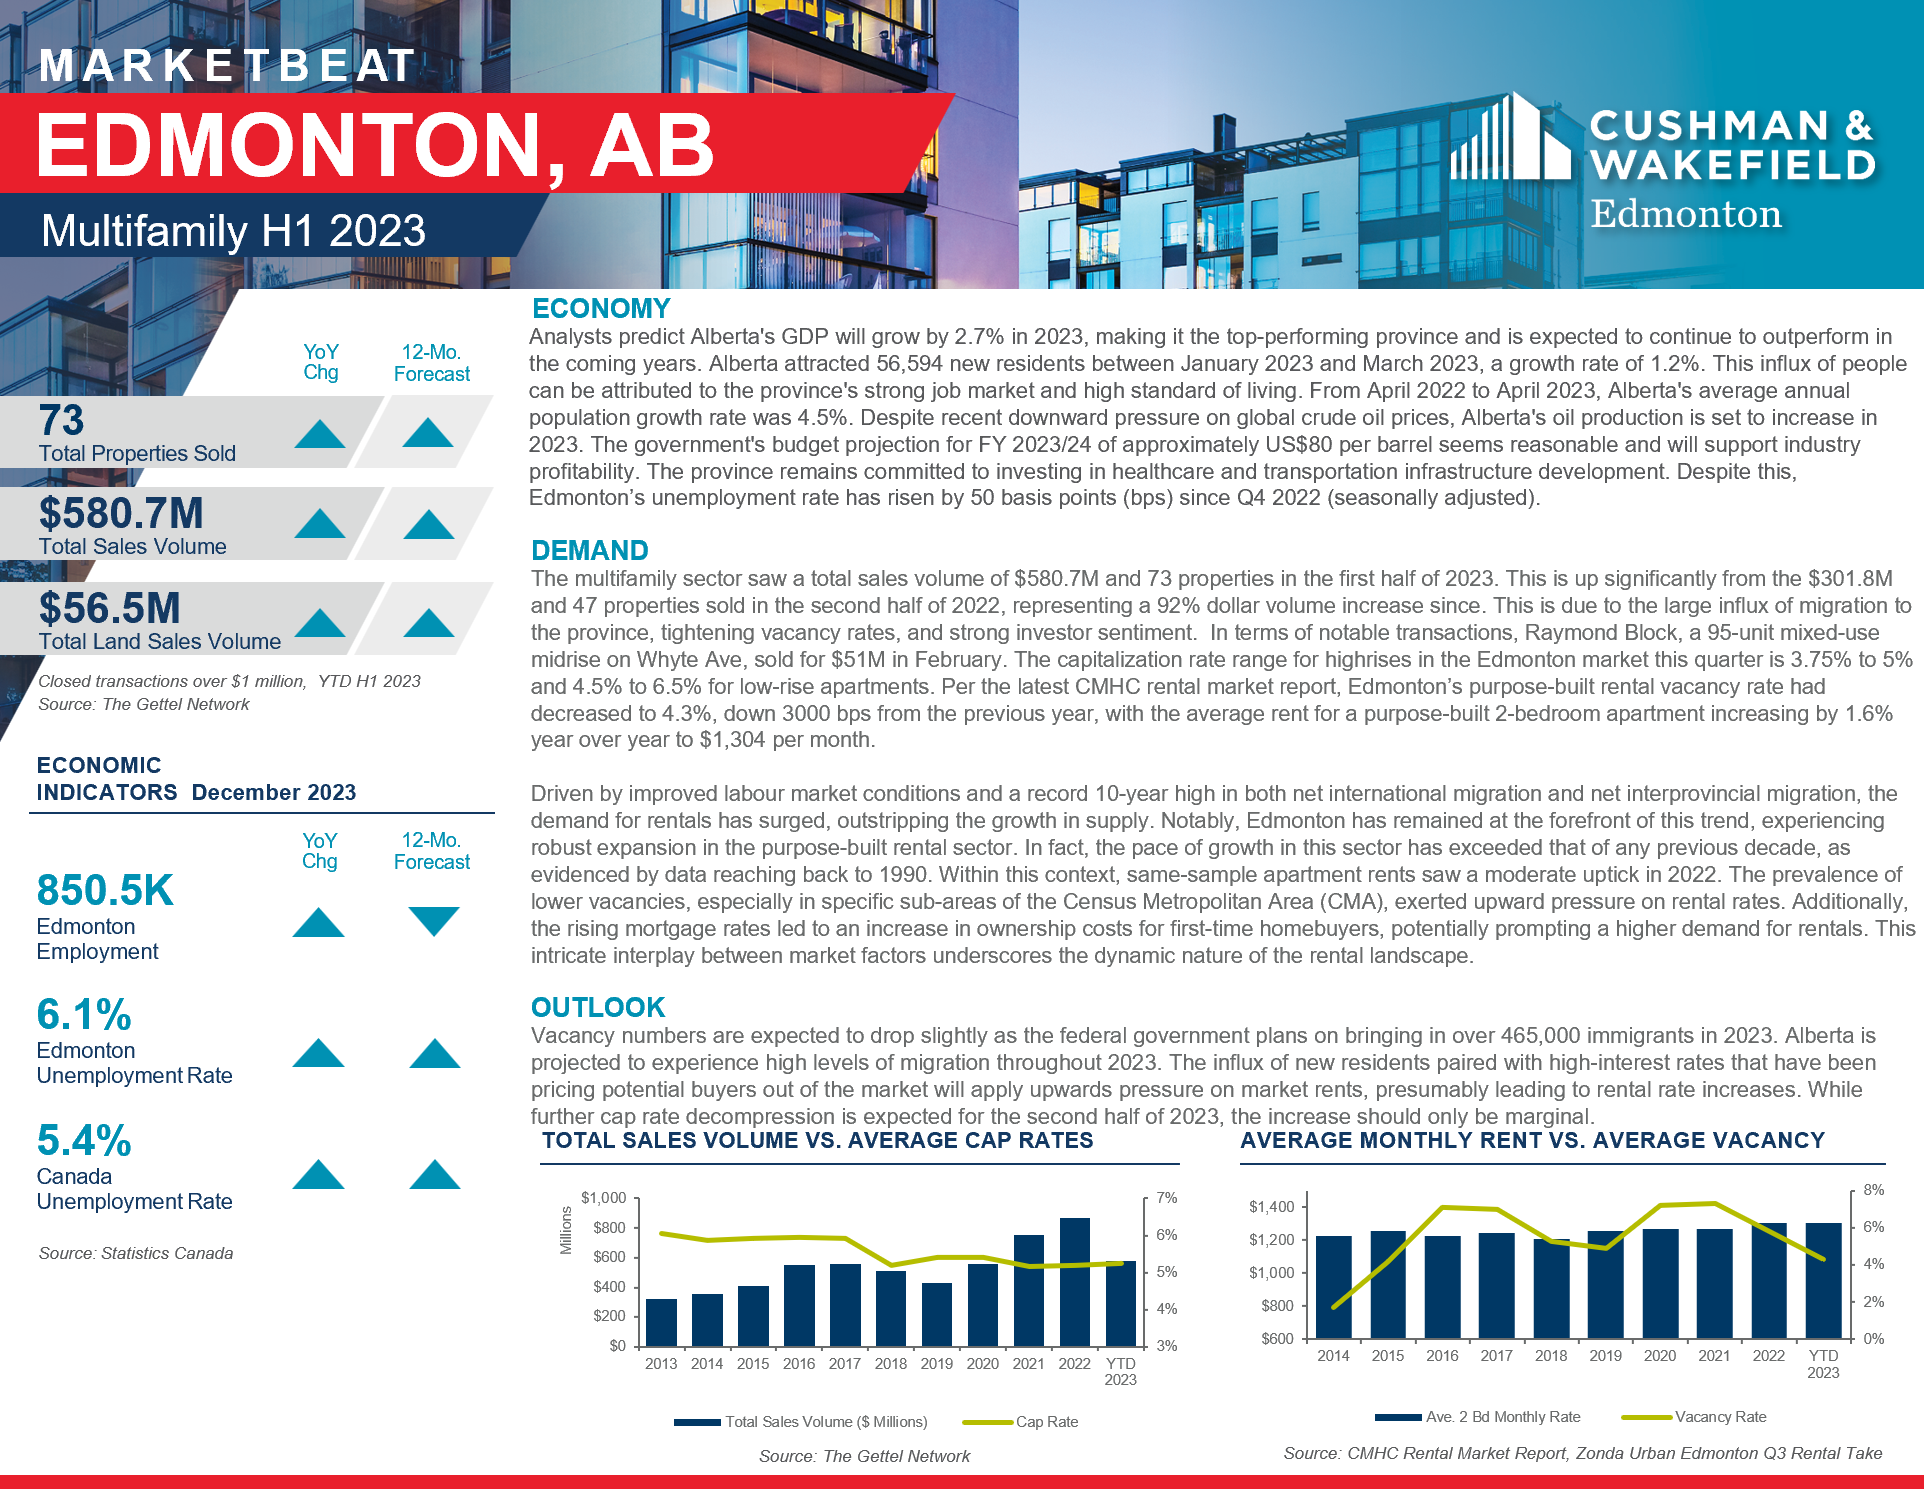
Edmonton’s multifamily market booms with $580.7M sales in H1 2023, driven by migration, tight vacancies, and investor sentiment.
H1. 2023 RETAIL
Posted: July 2023
Strong retail sales momentum in Alberta continues. January 2023 saw record-high sales at $8.7B. Immigration continues to stimulate demand. Edmonton’s retail market adapts, showing resilience and investment opportunities.
Q2. 2023 OFFICE
Posted: July 2023
Edmonton leasing steady; fewer major moves in Q2, but positive net absorption. Flight-to-quality persists, with landlords investing in properties and offering amenities. Suburban markets thrive, rents stabilize at $33.11 PSF.

